
Planning Poker vs. T-Shirt Sizing vs. Ideal Hours
Three common ways to estimate software work, what each one actually measures, and how to pick the right one - with the same story estimated all three ways.
Published October 12, 2026
What each method measures
Planning poker with story points
Planning poker is a consensus technique, first described by James Grenning in 2002[1]. Each person chooses an estimate privately; the estimates are revealed together; the people with the highest and lowest values explain their reasoning; and the team re-estimates until it converges. It is usually played with story points: a relative unit that blends effort, complexity and uncertainty, on a Fibonacci-like scale where the gaps widen as the numbers grow[2].
What it measures: how big a piece of work is compared with other work the same team has done.
T-shirt sizing
T-shirt sizing sorts work into a handful of categories — typically XS, S, M, L and XL. There is no arithmetic implied; the question is only “which bucket does this belong in?”
What it measures: rough relative size, at a deliberately coarse resolution.
Ideal hours (or ideal days)
Ideal time estimates how long the work would take one person or pair if they worked on nothing else, without interruptions. Early Extreme Programming teams estimated in ideal days before moving to points[3].
What it measures: focused effort, in a unit of time — but not elapsed calendar time.
One story, three estimates
Take a single fictional story: “Let customers export their invoice history as CSV.” It needs a new endpoint and query, a file format, a button on the invoices page, and tests. Some customers have a very large invoice history.
Planning poker
Four developers reveal 3, 5, 5 and 8. The person who chose 3 has built an export before and expects to reuse it. The person who chose 8 is worried about the largest accounts timing out. After a two-minute conversation, the team agrees the existing export code helps, but streaming large files is genuinely new — and settles on 5, with a note to test with a large account. The disagreement surfaced a real risk that a single estimator might have missed.
T-shirt sizing
The team puts it in M: bigger than adding a field to a form (S), much smaller than integrating a new payment provider (XL). The decision takes seconds. The performance risk doesn’t come up at all — the method is too coarse to ask for it.
Ideal hours
One developer breaks it into tasks: endpoint and query 4h, CSV formatting 2h, the button and download handling 2h, tests 3h, review and release 1h — 12 ideal hours. It is the most concrete answer, and the easiest to misread: a stakeholder hears “a day and a half”, while the elapsed time, once meetings, reviews and the large-account problem are included, may be several days. It also depends on who does the work.
Strengths and limitations
| Aspect | Planning poker (points) | T-shirt sizing | Ideal hours |
|---|---|---|---|
| Unit | Relative points, often 1, 2, 3, 5, 8, 13, 21 | Categories: XS, S, M, L, XL | Hours (or days) of focused work |
| Best for | Sprint planning with a stable team | Roadmaps, early backlog triage, large batches | Task breakdown, small well-understood work |
| Strengths | Independent votes surface disagreement; accounts for uncertainty; consistent within a team | Very fast; intuitive for non-engineers; avoids false precision | Easy to explain; maps directly to calendars and staffing |
| Limitations | Points are team-specific and easily misread as hours | Hard to add up or forecast with; sizes drift between people | Misses uncertainty; heard as a commitment; depends on who does the work |
How uncertainty and complexity show up
The less a team knows about a piece of work, the less any single number means. The methods handle that differently:
- Story points build it in. Uncertainty is part of what a point measures, and the widening Fibonacci gaps stop people pretending to know the difference between a 14 and a 15. A very large value, or widely spread votes, is itself a signal to split or investigate. A “?” card makes “I can’t estimate this yet” an acceptable answer.
- T-shirt sizes absorb it. The categories are so wide that uncertainty fits inside them — which is helpful early on, and unhelpful when you need to know whether the risk is real.
- Hours hide it unless you add it back. A single number like “12 hours” says nothing about confidence. Teams that estimate in time often use ranges or three-point estimates (best case, likely, worst case) to make the uncertainty visible.
Complexity behaves similarly. Points and T-shirt sizes let a team say “not much code, but tricky” is still big. An hours estimate tends to measure typing time and under-weight the thinking.
Choosing a method for your team
- Sizing a roadmap or a large backlog quickly? T-shirt sizes. Speed matters more than precision, and non-engineers can take part.
- Planning sprints with a reasonably stable team? Story points with planning poker. Independent estimates surface hidden disagreements, and the team’s own history gives the numbers meaning.
- Breaking a committed story into tasks, or quoting small, well-understood work? Hours — ideally as ranges, and with the understanding that ideal time is not calendar time.
- Using more than one? That is common and fine, as long as each decision uses one unit. Don’t add points to hours.
Whatever you choose, give it a few sprints before judging it, and change it deliberately as a team rather than piecemeal.
Where Async Pointing Poker fits
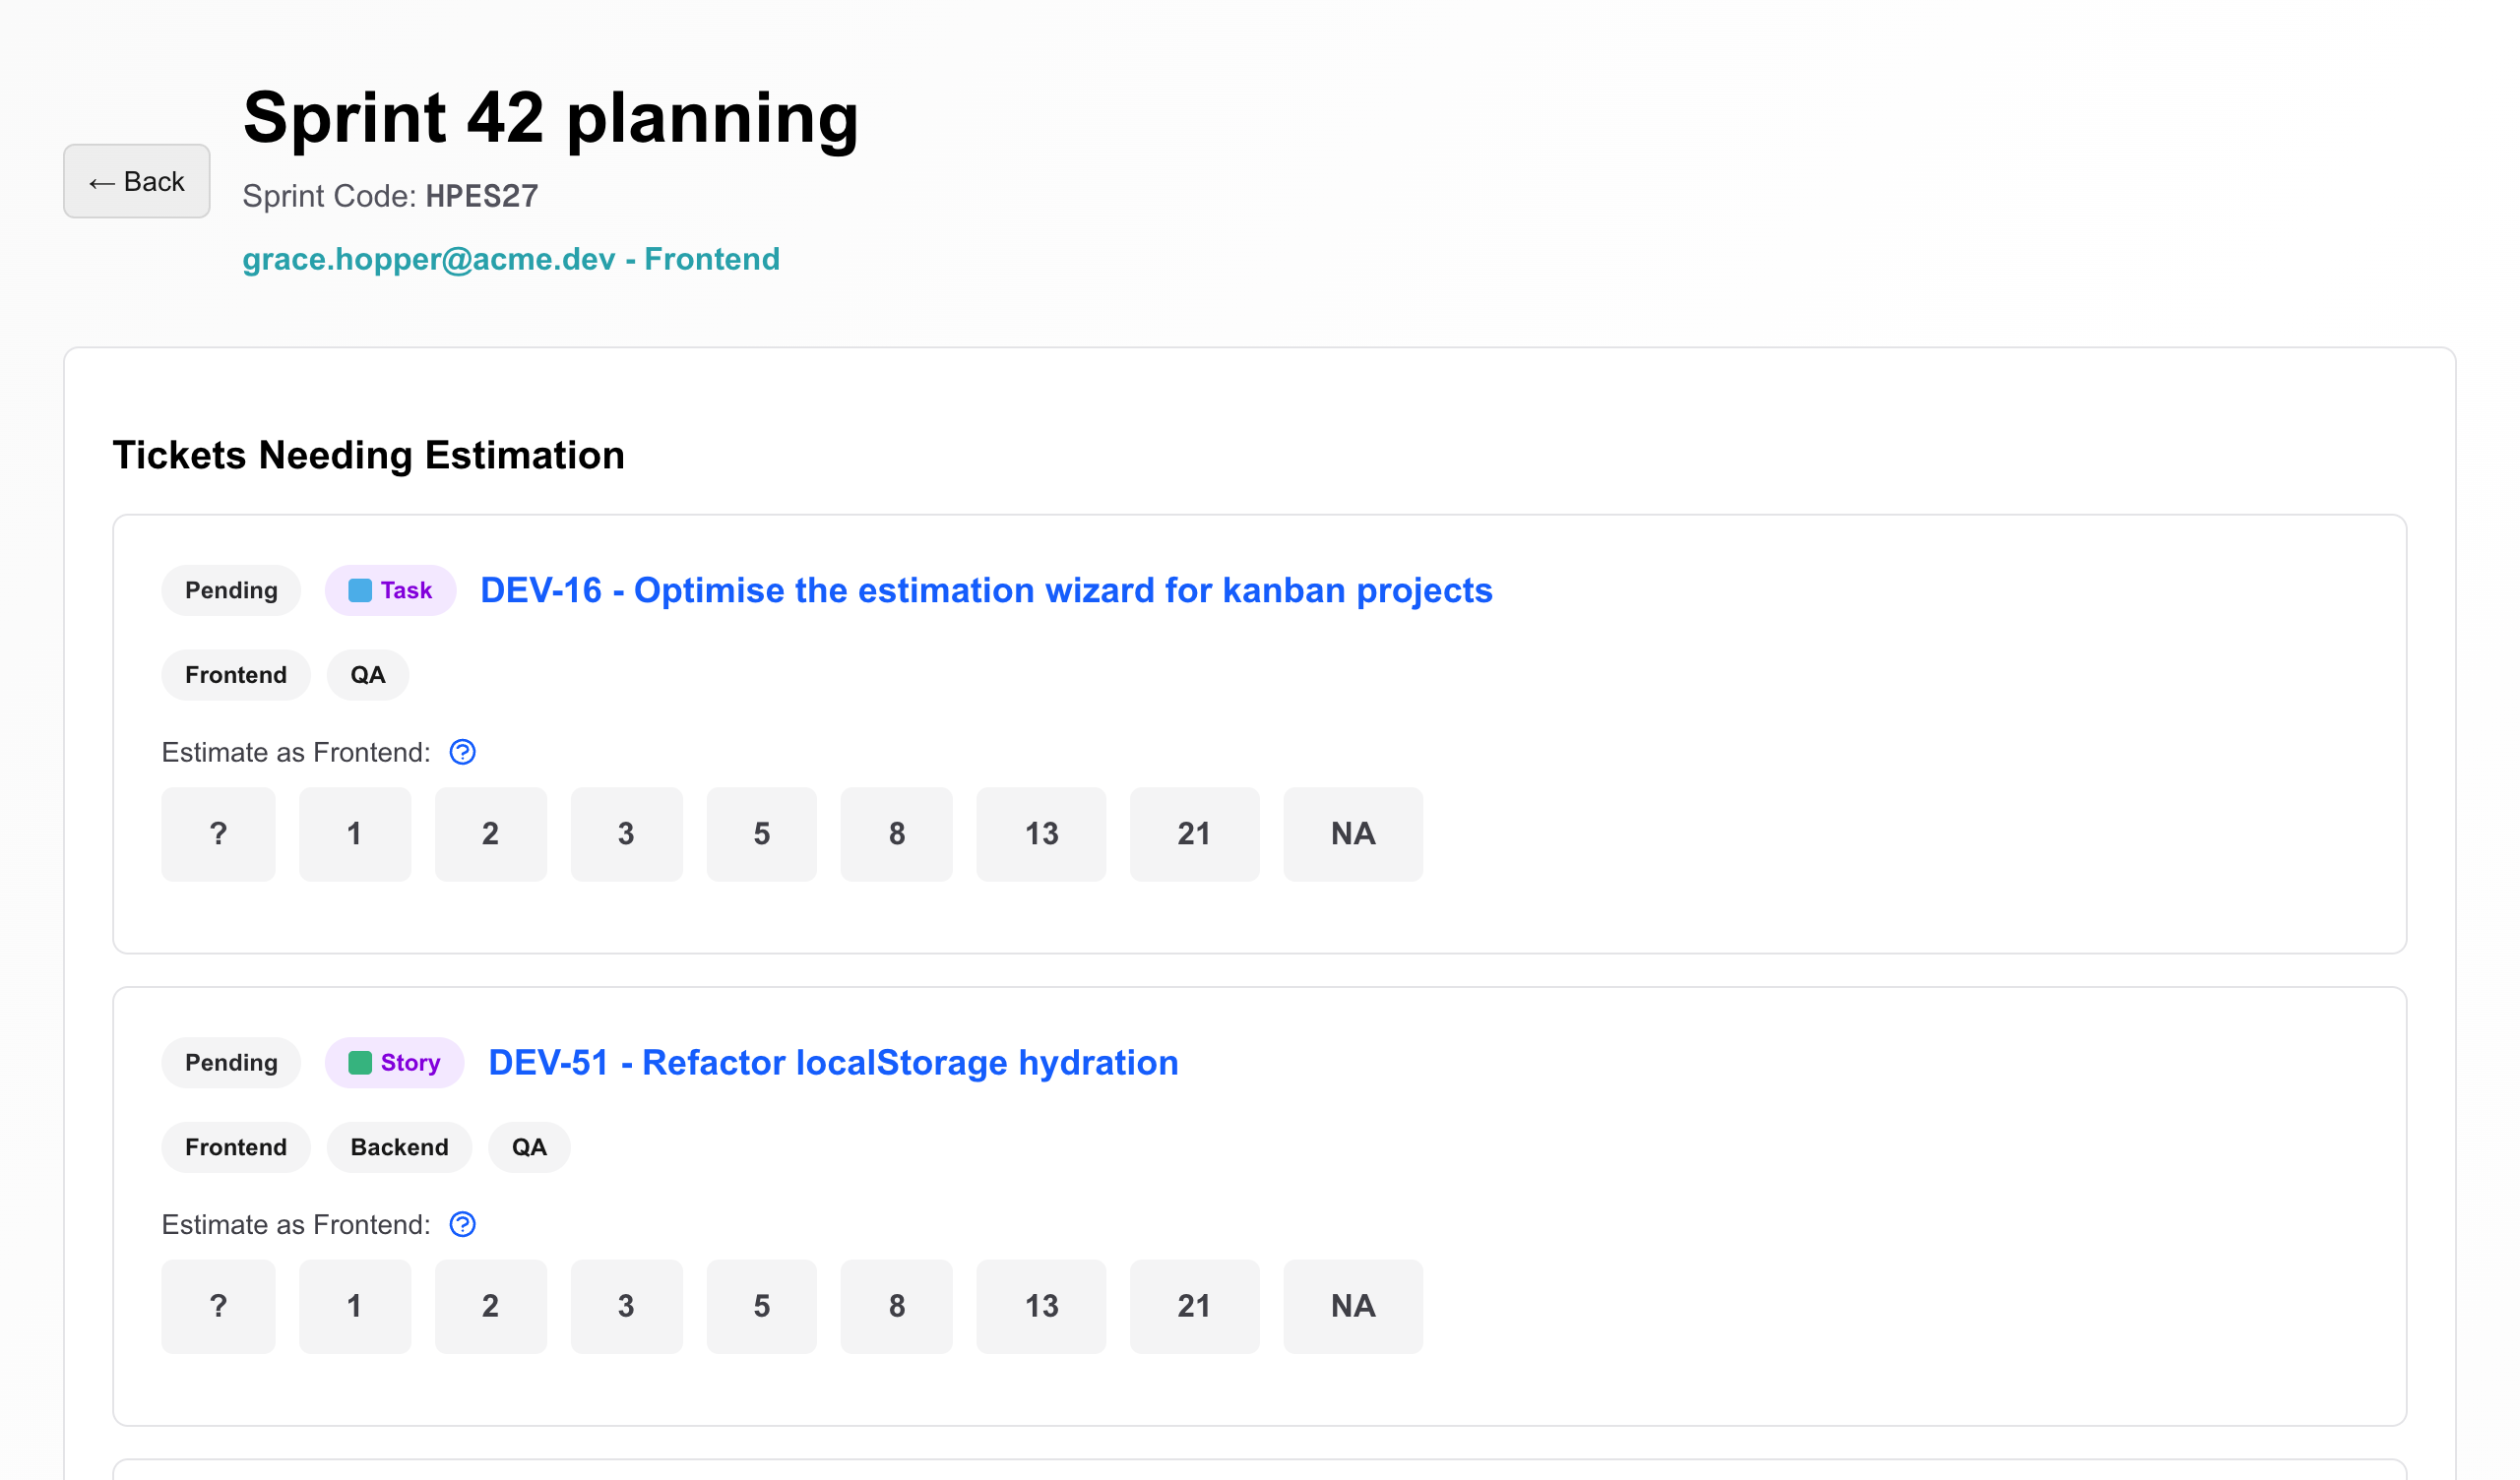
Async Pointing Poker is built for the first method: planning poker with story points, played asynchronously, for teams that track work in JIRA. It does not support T-shirt sizes or hour estimates — its scale is chosen from ?, 1, 2, 3, 5, 8, 13 and 21.
- Each person estimates privately, in their own time, seeing only their own answer.
- Tickets are tagged with the roles that should size them, and each role — for example Frontend, Backend and QA — gets its own value.
- When everyone in a role agrees, the ticket is accepted automatically; disagreements and “?” answers go to the Scrum Master’s review list for discussion.
New to points? Start with How Story Points and the Fibonacci Scale Work.
FAQ
Is planning poker the same as story points?
No. Story points are a unit; planning poker is a technique for agreeing on an estimate - everyone picks a value privately, the values are revealed together, and the team discusses the differences. Planning poker is most often played with story points, but the same reveal-and-discuss approach works with T-shirt sizes or hours.
Can T-shirt sizes be converted into story points?
Teams sometimes map sizes to numbers (for example S to 2, M to 5, L to 13) to sum them into a rough forecast. It works for coarse planning, but the precision is only as good as the sizes, so treat the totals as ranges, not commitments.
Why do ideal hours rarely match the actual time spent?
Ideal hours assume uninterrupted, focused work. Real days include meetings, reviews, support, context switching and waiting on others. That is not an estimating failure - it is why teams that estimate in ideal time also track how much ideal time they actually complete per sprint.
Can a team use more than one method?
Yes, and many do: T-shirt sizes for rough roadmap sizing, story points for sprint planning, and hours for breaking a committed story into tasks. The important thing is not to mix units within one decision - for example, not to sum points and hours together.
Sources
- ↩Planning poker (Wikipedia) — origin in James Grenning’s 2002 paper
- ↩Mike Cohn, “Why the Fibonacci Sequence Works Well for Estimating”
- ↩Ron Jeffries, “Story Points Revisited” (2019) — ideal days in early Extreme Programming